Data Analytics: A Game Changer For Software Engineers
data analytics is reshaping software engineering—helping developers make smarter choices, boost performance, and innovate faster.

Takeaway
- Data turns intuition into confidence
Analytics helps engineers move from “I think this is slow” to “I know exactly where and why.” - Your systems are already talking—you just need to listen
Logs, metrics, and traces tell stories about performance, errors, and user behavior every day. - Good engineering isn’t just writing code—it’s observing outcomes
Measuring what happens after deployment is as important as building the feature itself. - Small data steps create big clarity
You don’t need advanced analytics to start—basic metrics can reveal powerful insights. - Analytics shortens feedback loops
Problems surface earlier, fixes happen faster, and users feel the improvement sooner. - Data helps engineers prioritize what truly matters
Feature usage and performance metrics prevent wasted effort on low-impact work. - Post-mortems become learning tools, not blame sessions
Numbers help teams understand failures objectively and prevent repeats. - Performance issues are easier to fix when you can see them
Profiling and dashboards highlight bottlenecks that code reviews can’t catch. - Engineers who use data stand out
They make smarter decisions, ship more reliably, and can clearly show the value of their work. - Analytics builds proactive engineers, not reactive ones
The shift from firefighting to foresight is what separates mature teams from struggling ones.
Software engineering is changing. Every day, new tools arrive, problems grow more complex, and expectations shift. Amid all that, one thing is proving powerful: data analytics. For engineers, understanding data isn’t optional anymore—it’s a way to improve code quality, speed up decisions, and build systems that learn from their own behavior.
In this post, I’ll walk you through why data analytics matters to software engineers, practical ways to use it on real projects, pitfalls to avoid, and how to get started without feeling overwhelmed. The goal: give you concrete ideas you can try right away. Let’s dive in.
Why Data Analytics Matters To Engineers
When you think about software engineering, you usually imagine architecture diagrams, algorithms, pull requests, and tests. But behind every commit and deployment is data: logs, metrics, user behavior, errors, response times. Data analytics helps you see patterns buried in that noise.
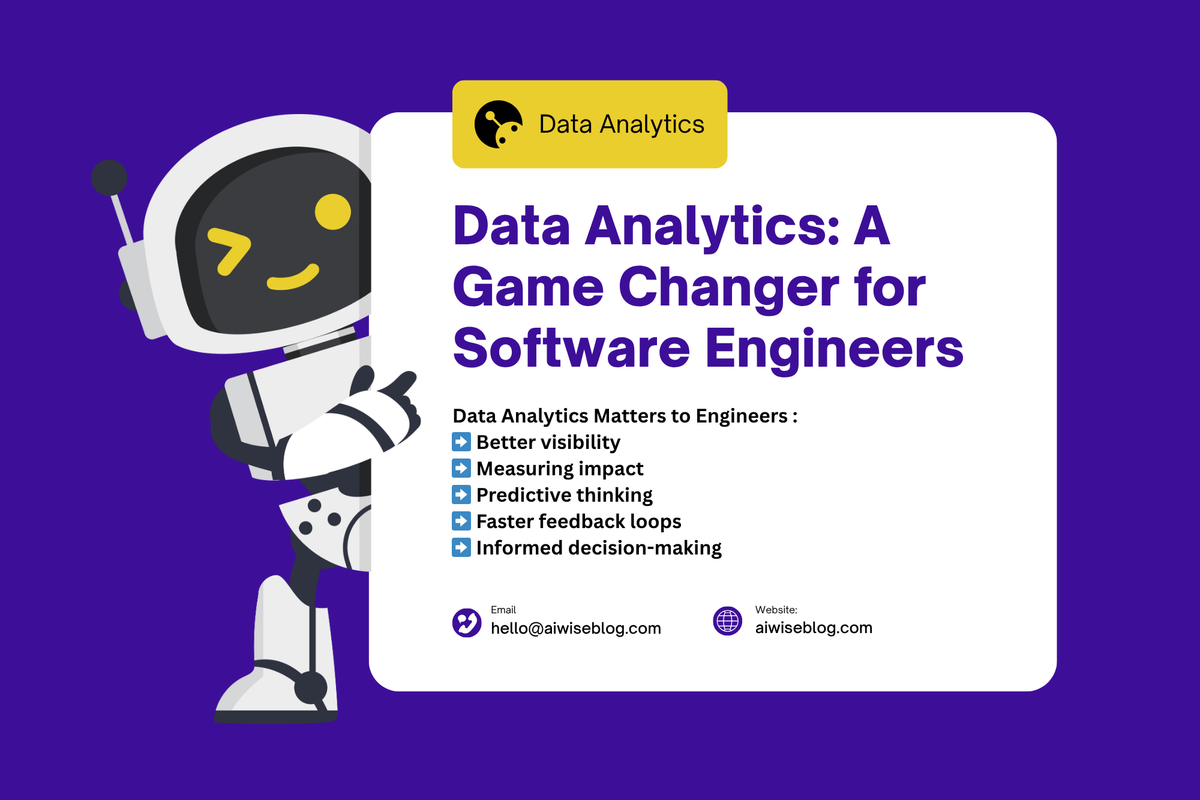
1️⃣ Better visibility
You can know exactly where your system is lagging, which endpoints are error-prone, and which UI components load slowly.
2️⃣ Faster feedback loops
Rather than waiting for users to complain, data that tracks key indicators lets you spot regressions early.
3️⃣ Informed decision-making
Should you refactor module A or add cache layer B? Analytics gives you evidence, not just intuition.
4️⃣ Measuring impact
When you build something new—say, a caching layer, or change how you batch API calls—you need to see if it actually helped. Data shows you that.
5️⃣ Predictive thinking
Once you collect enough history (error rates, traffic, latency), you can anticipate problems before they become emergencies.
Ways Engineers Can Use Data Analytics Right Now
You don’t need exotic tools or a full data science team to start. Here are practical ways to integrate analytics into your workflow.
1. Instrument Your Applications Well
Make sure you collect useful data: response times, error rates, memory usage, CPU, and request payload sizes. Add tags or metadata (e.g., which service, which version, which user type). Clean, consistent logs are gold.
2. Use Dashboards And Alerts
Visualizing key metrics helps. Dashboards for latency, error count, and throughput. Alerts when thresholds are crossed—say error rate jumps above 2%, or response times exceed 500ms. These make issues visible immediately.
3. Post Mortems With Data
When things go wrong (outages, performance degradations), dig into the numbers. Compare recent vs. past behavior. Look at traces. See which service or endpoint drifted. Use that insight to prevent future flare-ups.
4. Feature Usage Tracking
Which features do users hit most? Which ones are ignored? Engineers tend to build features they think will matter—but seeing what people actually use helps prioritize work. If you spent weeks building X and no one uses it, maybe it was not needed, or maybe the UI hid it.
5. Performance Profiling And Optimization
Data helps you find hotspots: memory leaks, slow queries, blocking I/O. Profilers, tracing tools, logs—combine them to see where time gets wasted. Then you can target optimization efforts more effectively.
6. A/B Testing Or Experiments
When changing behavior (e.g., caching strategy or UI change), try to compare: group A sees the old version, group B sees the new. Measure performance, error rates, and ,user satisfaction. That way you know if the change improved things or introduced regressions.

Tools & Techniques Voice Engineers Use
You’ll find many tools in the market. What matters is choosing ones that suit your team size, infrastructure, tech stack, and budget. Here are common categories:
⮞ Logging tools (Elasticsearch, Splunk, Loki) for raw logs.
⮞ Metrics and monitoring (Prometheus, Grafana, Datadog) for things like latency, request rates.
⮞ Distributed tracing (OpenTelemetry, Jaeger) to follow a request through multiple services.
⮞ Profiling and sampling (e.g., flame graphs, memory profilers) to find bottlenecks.
⮞ Experimentation tools (Optimizely, LaunchDarkly, internal frameworks) for controlled feature testing.
⮞ Pairing tools with good practice (version tagging, consistent naming, context propagation) makes them work well together instead of being siloed piles of dashboards.
SEO Tips For Data Analytics Content
If you maintain engineering blogs or documents and, SEO helps others find your insights. Here are tactics:
⮞ Use long-tail keywords: “engineering metrics for backend services,” “how to instrument APIs for performance,” “benchmarking request latency in microservices,” etc.
⮞ Write in clear terms. Engineers appreciate clarity: headings, bullet lists, code snippets, diagrams.
⮞ Share real data when possible. Graphs showing before and after numbers, latency curves, and resource usage trends.
⮞ Link to related content you own: case studies, internal blog posts, and, docs. Also, reference good external resources (official guides, tooling docs).
Getting Started Without Being Overwhelmed
If you feel daunted (you don’t need to), here’s a plan in steps that many engineers have used.
⮞ List three pain points in your current system. For example: slow API endpoints, unpredictable errors in production, and low feature usage.
⮞ Choose one that feels most urgent or most impactful. Maybe it’s the performance of the API. Or customer complaints about reliability.
⮞ Instrument for that issue: add timing to key endpoints, log errors with stack traces, and context. Visualize with a dashboard.
⮞ Set alerts so you know when things deviate. Tune thresholds based on what you observe.
⮞ After running for a few weeks, review logs and metrics. Did you reduce latency? Did errors drop? Where else could similar techniques help?
⮞ Document what you learned: what changed, what worked, and what didn’t. Share with the team. Use that insight to guide the next small project.
⮞ Over time, this builds confidence, and you’ll find yourself naturally using data to decide what to build, what to fix, and when.
Why Engineers Who Embrace Data Will Stand Out
As software engineering becomes more competitive, those who lean on data tend to ship more reliable, efficient, and user-friendly systems. Here’s what separates teams that use data well from ones that don’t:
⮞ They catch problems before users do.
⮞ They make changes with confidence, not guesswork.
⮞ They reduce wasted effort—fixing issues that analytics would have caught.
⮞ They continuously improve performance and scalability.
⮞ They can objectively prove the value of their work (to stakeholders, to customers).
Conclusion
Data analytics is a powerful lever for software engineers: it turns guesswork into clarity, reactive fixes into proactive improvements. If you start small, stay intentional, and build for value, the impact compounds. Metrics become your compass. Performance issues become opportunities. Features align with what users actually need.
If you’re ready to begin that journey—or refine how you do metrics, logging, and dashboards—there is more to read, explore, and learn. At aiwiseblog.com, we share stories, experiments, tools, and lessons from real engineering teams. Dive in. Your code, your system, and your users will thank you.
Frequently Asked Questions
What Metrics Should I Track First As A Software Engineer?
Start with the basics: request/response latency, error rates, traffic throughput (requests per second), and resource usage (CPU, memory). Those give you visibility into performance and reliability. Then expand into domain-specific metrics (e.g., user behaviour, feature usage) as you grow.
How Do I Avoid Alert Fatigue When Setting Up Monitoring?
Limit alerts to those events that require immediate action. Use tiers—critical, warning, info. Set thresholds that are meaningful (after observing normal behaviour). Silence non-urgent alerts or batch them. Review alerts regularly to adjust or remove ones that don’t help.
Do I Need A Data Science Team To Leverage Analytics In Software Engineering?
Not initially. Many teams succeed using simple dashboards, log tracing, and tool-based monitoring. As your scale increases or questions become more complex (forecasting, anomaly detection), you may bring in more specialised roles. But day one work is accessible without a full data science group.
How Often Should I Review My Metrics And Dashboards?
Regularly. Weekly for core performance metrics, alert logs, and error trends. Monthly for feature usage, system architecture decisions, and capacity planning. After significant changes or deployments, check immediately to see if anything broke or degraded.
How Can Feature Usage Data Influence Engineering Decisions?
Imagine you build a feature expecting many users will love it—but usage is tiny. That might mean the UI flow is bad, the feature is hard to discover, or it was solving a non-urgent problem.


